X-ray Spectromicroscopy of Polymers:
An introduction for the non-specialist+
Ivaylo Koprinarov and Adam P. Hitchcock
BIMR, McMaster University
Hamilton, ON Canada L8S 4M1
Get
this document as a pdf file
+ This document is intended to be an informal introduction
of a tutorial nature, rather than an historical or comprehensive overview.
Please see the articles referenced for more complete presentations of the
technique and its many applications.
1. Introduction
X-ray absorption spectroscopy has advanced rapidly in the last
decades, particularly with synchrotron radiation based techniques [stohr
92]. The high brightness of the synchrotron X-ray source has allowed tremendous
improvements in spectral resolution and the development of X-ray microscopies
which apply X-ray absorption spectroscopy to heterogeneous materials at
high spatial resolution. Novel characterisation techniques are being developed
[ade 98] which allow both spectromicroscopy - imaging with spectral
sensitivity, and microspectroscopy - recording spectra from very
small spots. We choose to call these novel analytical tools X-ray spectromicroscopy,
to emphasize that it is the combination of spectroscopy and microscopy
that is the essence of these techniques. This article describes one of
these techniques, scanning transmission x-ray microscopy (STXM)
[ade 97, warwick 97, warwick 98], and illustrates its capabilities through
two selected applications in polymer analysis [ade 92, ade 93, ade 95,
smith 96]. Authoritative reviews of STXM have been published which stress
materials [ade 98, ade00] and biological [kirz 95] applications.
There are many problems in polymer physics and chemistry which require
detailed chemical analysis at a sub-micron spatial scale - phase segregation;
determination of the morphology and interface chemistry of blends and co-polymer
systems; nano-patterned structures, self assembly; and many others. Traditional
chemical spectroscopies used for polymer studies such as infrared and nuclear
magnetic resonance can differentiate chemical species but they do not have
the necessary sub-micron spatial resolution. Analytical transmission and
scanning transmission electron microscopy have excellent spatial resolution
and are very useful to visualise the structure, but electron microscopy
typically does not have sufficient chemical sensitivity for
quantitative chemical mapping beyond the elemental level. In many cases
it is ambiguous whether structure observed by electron (or optical) microscopy
arises from chemical differences or if it is simply caused by density/thickness
variations or reflectivity changes (optical). In addition, electron microscopy
of polymers is experimentally difficult on account of high rates of radiation
damage by energetic electron beams [Egerton 87].
2. Near Edge X-ray Absorption Fine Structure
As an x-ray passes through matter, it is absorbed to an extent which
depends on the nature of the substance, the thickness of the sample, and
the density of the sample. The absorbed photons cause excitation of the
inner shell electrons of the atoms in the substance. These excited inner
shell (core) electrons can be promoted to unoccupied energy levels to form
a short lived excited state or they can be removed completely to
form an ionized state. Traditionally, X-ray absorption spectroscopy
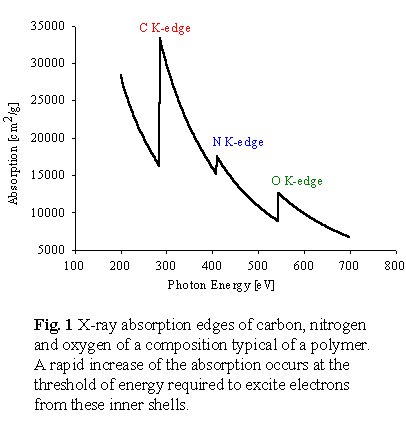
was described in terms of absorption edges which are the onsets
of inner-shell ionization (Figure 1). There is an absorption edge
associated with each inner shell energy level of an atom, such that all
elements have an X-ray absorption edge in the soft X-ray energy range (100-1200
eV). The amount of a particular element can be determined quantitatively
from the difference in the x-ray absorption just above and just below its
absorption edge.
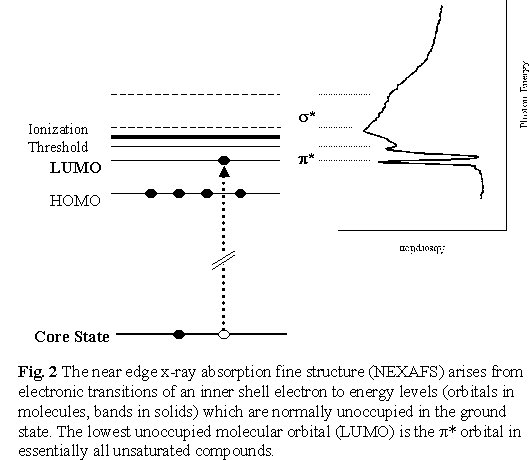
While this traditional aspect of X-ray absorption provides the basis
for elemental analysis, the modern technique as practised at synchrotron
facilities is much more powerful. It can identify and quantitate the chemical
structure of the element from the fine scale details of the absorption
spectrum that occur at each edge, the so-called near-edge x-ray absorption
fine structure or NEXAFS [Stohr 92]. These features, which can be as
much as 10 times stronger than the absorption edge jump, correspond to
electronic excited states in which an inner-shell electron has been excited
to unfilled molecular orbitals or conduction bands. As the x-ray energy
is increased throughout an absorption edge, first there is structure associated
with excitation to the lowest unoccupied molecular orbital, which is a
p
* orbital for unsaturated molecules (double or triple bonds), followed
by structures associated with higher energy unoccupied molecular orbitals,
typically of s * character associated with saturated
(single) chemical bonds, and then direct inner-shell ionization (Figure
2).The unoccupied electronic structure and thus the inner-shell excited
states are determined by the geometric and electronic (bonding) structure
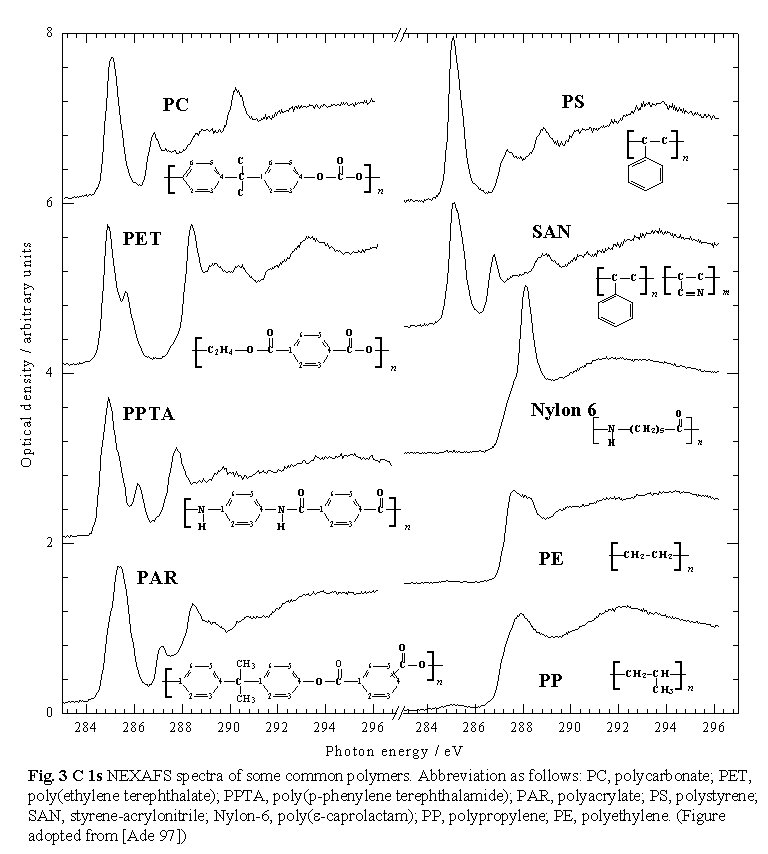
of the sample. NEXAFS spectra differ significantly even for rather similar
molecular structures, as shown in Figure 3 for some common polymers
[Ade 97b]. This means that the NEXAFS spectrum of each polymer can be used
as a fingerprint. In many cases, enough is known about how chemical
structure and X-ray absorption spectral features are related to allow one
to identify unknown species from measured NEXAFS spectra. Individual spectral
features, particularly the low energy p * features,
are often sufficient for qualitative identification in reasonably well
characterized systems, and they can serve as useful energies for selective
chemical contrast in X-ray microscopy. There is characteristic NEXAFS structure
at the absorption edge of each element in a sample. Thus combined studies
of C 1s, N 1s and O 1s NEXAFS is a very powerful tool in polymer analysis.
Finally, comparisons with NEXAFS spectra of pure standards provides a means
to derive quantitative composition maps of the components of a complex
material from a series of X-ray microscopy images.
3. Scanning Transmission X-ray Microscope (STXM): Simple Description
and Operation
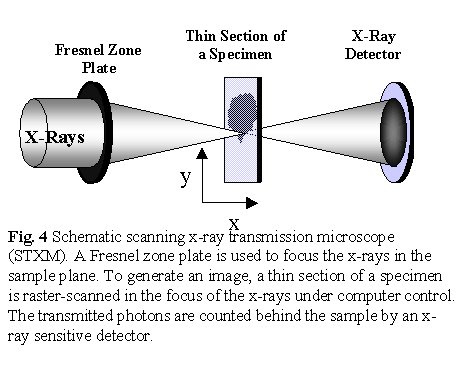 A
simplified view of STXM is shown in Figure 4. A Fresnel zone
plate focuses mono-energetic X-rays provided by a suitable monochromator
beamline mounted on a suitable, bright synchrotron source. The focal point
is typically 50 nm in diameter over a 3-10 mm
waist. An image is generated by monitoring the X-ray signal transmitted
through a thin section of a specimen as it is raster-scanned at the focus
of the x-rays. Micro-spectra are measured by holding the beam at the spot
of interest on the sample while the photon energy is scanned. The sample
in a STXM can be mounted in air (with sufficiently short X-ray path length),
in He at atmospheric pressure, or even sandwiched between two X-ray transparent
silicon nitride windows. The latter approach is used to study wet samples
such as hydrated polymers [Mitchell99] or biological material [Kirz95].
A
simplified view of STXM is shown in Figure 4. A Fresnel zone
plate focuses mono-energetic X-rays provided by a suitable monochromator
beamline mounted on a suitable, bright synchrotron source. The focal point
is typically 50 nm in diameter over a 3-10 mm
waist. An image is generated by monitoring the X-ray signal transmitted
through a thin section of a specimen as it is raster-scanned at the focus
of the x-rays. Micro-spectra are measured by holding the beam at the spot
of interest on the sample while the photon energy is scanned. The sample
in a STXM can be mounted in air (with sufficiently short X-ray path length),
in He at atmospheric pressure, or even sandwiched between two X-ray transparent
silicon nitride windows. The latter approach is used to study wet samples
such as hydrated polymers [Mitchell99] or biological material [Kirz95].
The STXM at the Advanced Light Source (ALS) which we use can
record images with better than 100 nm spatial resolution, and NEXAFS spectra
from 150 - 1400 eV with an energy resolution of about 100 meV [warwick
97, warwick 98]. Samples must be partly transparent at the X-ray energy
of interest, which means a sample thickness of 50 to 300 nm for carbon
studies, ranging up to 1 - 2 microns thick for higher energy edges or low
density samples such as hydrated polymer gels or biological samples. The
sample preparation challenges are similar to those encountered for analytical
transmission electron microscopy. Microtomed sections about 100 nm thick
which are mounted on 3 mm metal grids are a common form of sample. We use
silicon wafers with X-ray transparent, 100 nm thick silicon nitride windows
(of up to 4 mm lateral size) to study samples in water. One can even do
N 1s spectroscopy through these windows. A strength of STXM relative to
electron microscopy is that radiation damage is two orders of magnitude
less than in electron beam imaging techniques [rightor 97], making this
technique ideally suited for radiation sensitive polymers.
The transmitted X-ray signal is measured by single photon counting using
counting periods (dwell times) of 0.2 - 0.5 ms per pixel for imaging. A
300x300 pixel image takes about 30 seconds to acquire. Typically, many
problems can be solved by measuring a small number of images at selected,
chemically sensitive images. In cases where one needs a very detailed chemical
analysis of a specific region it is useful to take a systematic series
of images at a fine mesh of energies around the absorption edge of interest.
These image sequences - which might involve one hundred 100x200
pixel images, or about 8 Mb of raw data - can be processed off-line in
a variety of ways for both qualitative species identification and to derive
quantitative composition maps. Examples of these approaches are shown below.
For quantitative analysis, the transmitted signal is converted to an
optical density (OD) according to
OD = ln(Io/I)
where for a given X-ray energy I0 is the incident
x-ray flux, I is the transmitted flux through the sample, and ln
is the natural logarithm. The OD is related to the sample properties by
OD = µ(E).r .t
where m(E) is the mass absorption coefficient
at X-ray energy E, r is the density and t is
the sample thickness. The mass absorption coefficient is derived from measurements
of the NEXAFS spectra of the pure material. Practically, spectra are obtained
by first recording an energy scan I from the spot of interest and
subsequently the incident flux Io measured with the same
detector and optical path but with the sample out of the beam. Typically,
this takes a few minutes.
4. Example 1: Qualitative polymer analysis
This is part of a study [Hitchcock 00] of reinforcing filler particles
which are used in moulded compressed polyurethane foams in the automotive
and furnishing industries to achieve higher hardness and load bearing capability.
STXM was been used to study two types of copolymer polyol (CPP) fillers
hard polymer particles dispersed in a polyether polyol - present in a
toluene di-isocyanate-based polyurethane. One CPP is a copolymer styrene
and acrylonitrile (SAN). The other CPP is an aromatic-carbamate rich poly-isocyanate
poly-addition
product (PIPA), derived from methylene diisocyanate. Both particles are
chemically indistinguishable by transmission electron microscopy (Figure
5) although the size and spatial distribution are clearly revealed.
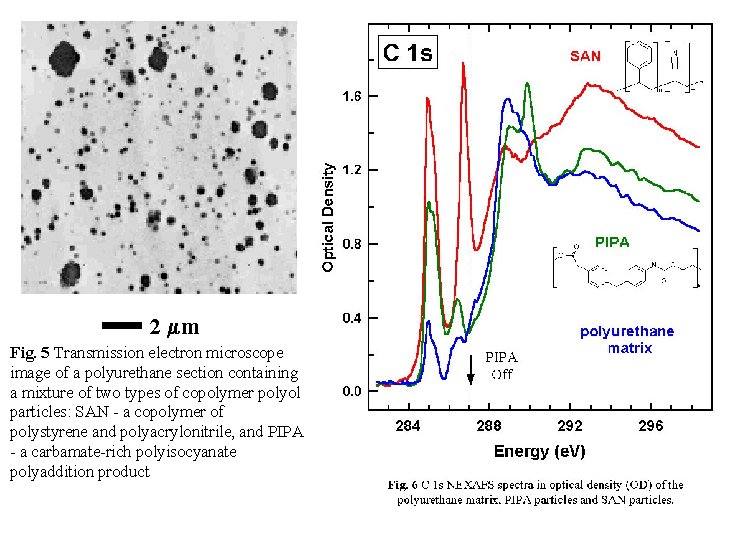
Chemical selective imaging in the C 1s NEXAFS (Figure 6) identifies
the SAN and PIPA particles unambiguously. Since the spectra of both SAN
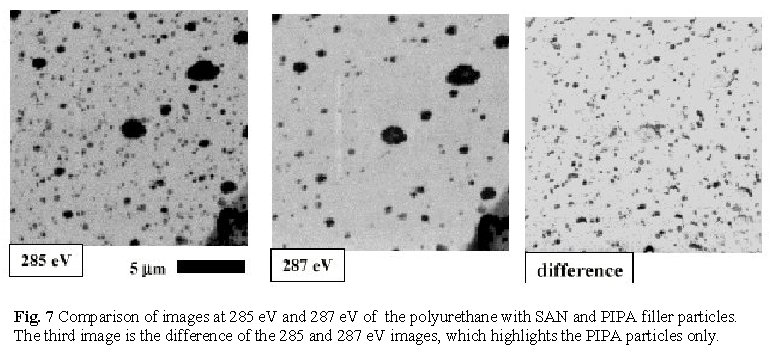
and PIPA absorb strongly at 285.0 eV associated with the phenyl groups
of the aromatic filler particles, images at 285.0 eV show both types of
particles and thus the 285 eV image (Figure 7a) is identical to
the electron microscopy image. Only SAN has a strong absorption at
286.7 eV, associated with the acrylonitrile component (AN). Thus imaging
at 287 eV, on the higher energy side of this peak where the optical density
of the PIPA particles and the matrix is the same and low compared to the
SAN particles, gives an image in which only SAN particles are in high contrast
(Figure 7b). After subtracting the 287 eV from the 285 eV image,
the PIPA particles can be identified without difficulty (Figure 7c).
This example dramatically demonstrates that NEXAFS microscopy can be a
quick and reliable means to differentiate chemical species at a sub-micron
spatial scale. Further analysis of this material has lead to full quantification
of the CPP particle compositions, and detailed size distribution analyses
for each type of particle. Neither of these aspects would have been achievable
by analytical electron microscopy.
5. Image processing and advanced results
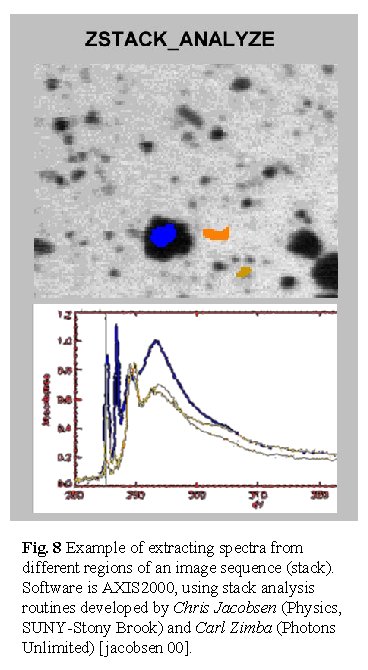
Recording sequences of images with short dwell time and fine energy
spacing can be very useful [jacobsen 00]. For instance, post-processing
of the images series can be used to extract spectra at any subset of pixels
in the sampled region, long after the measurement is finished. This approach
can provide serendipitous discoveries. An example of this for the PIPA-SAN
polyurethane filler particle system is shown in Figure 8. Relative
to multiple single point measurements, image sequence procedures also minimize
radiation damage. At the ASL point spectra cannot be acquired without exposing
the sample to ~200 msec per energy point, or say, 20 seconds for a 100
point energy scan. In contrast, image sequences which can provide statistical
precision of 1-2% in a 0.2x0.2 m m region can
be acquired with dwell times per pixel of 0.5 msec, or 50 msec total for
the full 100-point energy spectrum. Of course damage is not restricted
solely to the point sampled but even so, there is a reduction in dose of
several orders of magnitude relative to point scan mode.
Another application of image sequences is quantitative analysis.
The absorption signal from a given column of the sample is related to the
amount of each component, the x-ray absorption response of each component,
and the overall thickness and density of the material in the column. Since
NEXAFS spectra for pure materials can be obtained with accurate mass absorption
scales, STXM can be used for quantitative analysis at sub-micron ranges
[Koprinarov 00]. Quantitative composition maps can be derived by two different
approaches singular value decomposition (SVD) [Koprinarov 00] and
image
sequence fits [Kneedler 00]. A brief description of each follows.
Singular value decomposition
The optical density is determined by the formula OD = µ.r
.t, where µ is the energy-dependent mass absorption coefficient
(cm2/g), r is the density (g/cm3),
and t is the sample thickness (cm). If the mass absorption coefficients
of each components are known at the energies sampled, the problem can be
converted to a simple superposition and linear algebra can be used to convert
sets of images into equivalent thickness (rt(x,y))
or composition maps. In principle, the decomposition problem can be expressed
as a matrix equation Ax=d, where x is a vector
describing the unknown distribution of each component (rt),
d
are
the measured images (converted to OD scale), and A is the matrix of the
mass absorption coefficients (µ) obtained from reference spectra
for each component, converted to mass absorption scale. The advantage of
the singular value decomposition procedure is that, once the absorption
coefficients for a set of materials and energies are known, one can calculate
a
priori the matrix which will optimally invert an over-determined sampling
of energies into the best possible component maps. It can be shown that
the SVD solution is the least squares solution [strang 88, press 92].
Image sequence fits
Image sequence fitting [hitchcock 00] computes a least squares fit of
the intensity at each pixel(j,k) to a linear combination of reference spectra
for each component (converted to mass absorption scale). An energy-independent
(constant) term (ao) is also usually included to accommodate
unexpected backgrounds:
OD(j,k) = ao + Si ai * OD-modeli
The vertical scale of the derived component maps in either analytical method
is the (density*thickness ) product of each component. If the density is
known, or can be estimated (in many polymer systems it is within 10% of
1.0) then the component maps provide a true thickness map. [Koprinarov
00].
_________________
6. Example 2; Quantitative chemical mapping at sub-micron resolution
The second example illustrates an application of image sequence analysis
[Croll00]. Polymer capsules and particles with tailored walls, and
core-shell structures are attractive for a wide number of applications,
including separation science applications, adhesives, coating, chemical
delivery, etc. [Li99]. In order to optimise for a particular application,
e.g. designing the wall properties for controlled release of a specific
chemical, one needs to perform accurate quantitative analysis of the chemical
structure of the wall at high spatial resolution. The polyurea capsules
are made by dispersing a mixture of aromatic isocyanate and xylene in an
aqueous solution of a polyamine. Interfacial polymerisation reactions of
both the amine and water with the isocyanate occur at the surface of the
dispersed hydrophobic, organic droplets. Competition among amine-isocyanate
and water-isocyanate reactions is controlled by differences in kinetics
and diffusion rates. This can lead to chemically structured capsule walls.
The amine-isocyanate reaction forms an asymmetric (aromatic-aliphatic)
urea whereas the water-isocyanate forms a symmetric di-aromatic urea.
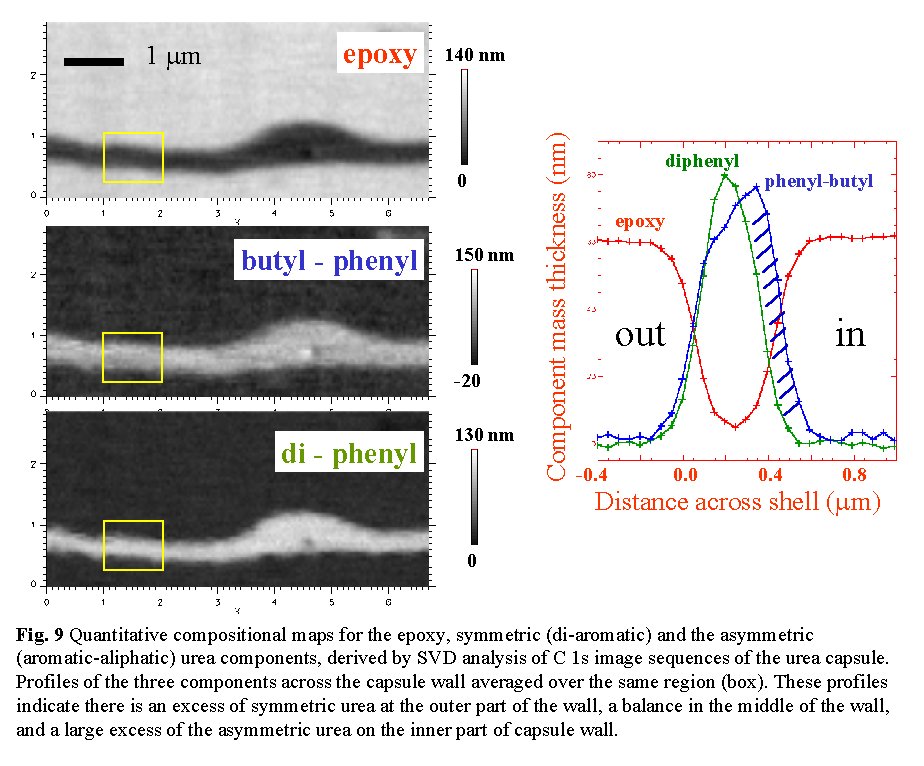
We have used quantitative NEXAFS microscopy to visualize the gradient
of chemical composition across a capsule wall formed in this manner. Figure
9 presents component maps derived from image sequences using singular
value decomposition and model spectra taken from small molecule analogues.
The vertical scale of these maps represents the thickness in nm of that
component. The profiles across the capsule wall in the region marked on
the maps, show that there is an internal chemical structure to the capsule
wall, and that this structure reflects the expected changes arising from
the synthetic methodology. In particular, the symmetric di-aromatic urea
from the water-isocyanate reaction is a narrower band at the outer region
of the wall, whereas the asymmetric urea arising from the amine-isocyanate
reaction is thicker and extends all the way to the inner side of the capsule
wall. Please note that the total wall thickness is only 500 nm and the
differences in chemical composition are observed with better than 100 nm
spatial resolution. This precision of chemical quantification at high spatial
resolution demonstrates that STXM is a powerful analytical tool which can
provide assistance in the development of structured polymeric systems which
cannot be provided by any other technique.
Outlook
There are only a few STXM microscopes in the world. The instrumentation
was originally developed by Kirz and collaborators (SUNY-Stony Brook) and
the Kirz and Jacobsen groups operate three STXM at the X1 undulator beamline
at the National Synchrotron Light Source in Brookhaven. At the Advanced
Light Source, there is one operating STXM on beamline 7.0. An upgrade of
this microscope will be installed in fall 2000. A second STXM beamline
dedicated to polymer and soft materials analysis is under construction
at the ALS. It will be operational by the end of 2000. A third centre for
STXM is the Kings College instrument at beamline 5U2 in Daresbury, England.
Other STXM instruments are under construction at BESSY II in Berlin, at
Daresbury and at the Korean synchrotron.
If you are interested in analytical studies of polymers or other
materials using STXM or other X-ray microscopy techniques, please contact
Adam Hitchcock
BIMR
McMaster University
Hamilton, ON L8S 4M1 Canada
Tel: 905 525-9140 ext 24749
E-mail: aph@mcmaster.ca
Acknowledgements
We thank Harald Ade for sharing beam time, results and a common perspective.
The contributions of many people who helped develop, optimise and maintain
the ALS STXM have been critical - we note in particular the contributions
of Tony Warwick and George Meigs. The ALS BL 7.0 STXM was developed by
T. Warwick (ALS), B.P. Tonner and collaborators, with support from the
U.S. DOE under contract DE-AC03-76SF00098. The research described in this
article is funded by strategic and research grants from the Natural Sciences
and Engineering Research Council (NSERC) of Canada.
References
[ade 92] H. Ade, X. Zhang, S. Cameron, C. Costello, J.
Kirz, and S. Williams, Science, 258, 972 (1992)
[ade 93] H. Ade and B. Hsiao, Science, 262,
1427 (1993)
[Ade 95] H. Ade, A. Smith, S. Cameron, R. Cieslinski,
C. Costello, B. Hsiao, G.E. Mitchell, and E.G. Rightor, Polymer,
36,
1843 (1995).
[ade 97] H. Ade, A.P. Smith, H. Zhang, B. Winn, J. Kirz,
E. Rightor and A.P. Hitchcock, J. Electron Spectrosc. 84,
53 (1997).
[ade 98] H. Ade, in Experimental Methods in the Physical
Sciences, Vol. 32, pp. 225, J.A.R. Samson and D.L. Ederer Ed., Academic
Press, 1998.
[ade 00] H. Ade and S.G. Urquhart, Chemical Applications
of Synchrotron Radiation ed. TK Sham, (World Scientific, 2000, in press)
[Croll 00] L.M. Croll, I. Koprinarov, A.P. Hitchcock,
W.H. Li, and H. Stöver, in preparation.
[Egerton 87] R. E. Egerton, P. A. Crozier, P. Rice, Ultramicroscopy,
23,
305 (1987).
[hitchcock 00-a] A. P. Hitchcock, I.Koprinarov, T. Tyliszczak,
E. G. Rightor, G. E. Mitchell, M. T. Dineen, W. Lidy, R. D. Priester, S.
G. Urquhart, A. P. Smith, H. Ade, submitted.
[hitchcock00-b] A.P. Hitchcock, I. Koprinarov, K. Pecher,
and E.M. Kneedler, in preparation
[jacobsen 00] C. Jacobsen, S. Wirick, G. Flynn, and C.
Zimba, J. Microscopy 197, 173 (2000).
[Kirz96] J. Kirz, C. Jacobsen and M. Howells, Quarterly
Review of Biophyisics, 33 , 33 (1995).
[Koprinarov 00] I. Koprinarov, A.P. Hitchcock, K. Dalnoki-Varess,
C. Murray, J. Dutcher, and H. Ade, in preparation.
[Li99] W.-H. Li and H.D:H Stöver, J. Polym. Sci.,
Polym. Chem. 37, 2295 (1999).
[mitchell99] G.E. Mitchell et al, ALS Compendium of Abstracts,
1999
[press 92] W.H. Press, et al. Numerical Recipes in
C: The Art of Scientific Computing. Cambridge: Cambridge University
Press, 1992.
[rightor 97] E.G. Rightor, A.P. Hitchcock, H. Ade, R.D.
Leapman, S.G. Urquhart, A.P. Smith, G. Mitchell, D. Fischer, H.J. Shin
and T. Warwick, J. Phys. Chem. B 101, 1950 (1997).
[Smith 96] A. P. Smith and H. Ade, Appl. Phys. Lett.
69,
3833 (1996)
[Stohr 92] J. Stöhr, NEXAFS Spectroscopy,
Springer-Verlag, Berlin, 1992.
[strang88] G. Strang, Linear Algebra and Its Applications.
San Diego: Harcourt Brace Jovanovich, 1988
[warwick 97] T. Warwick, H. Padmore, H. Ade, A.P. Hitchcock,
E.G. Rightor and B. Tonner, J. Electron Spectrosc. 84, 85
(1997).
[warwick 98] T. Warwick, K. Franck, J.B. Kortwight, G.
Meigs, M. Moronne, S. Myneni, E. Rotenberg, S. Seal, W.F. Steele, H. Ade,
A. Garcia, S. Cerasari, J. Denlinger, S. Hayakawa, A.P. Hitchcock, T. Tyliszczak,
E.G. Rightor, H.-J. Shin and B. Tonner, Rev. Sci. Inst. 69,
2964 (1998).